
Building a Research, Testing, and Optimization practice
Project Summary
Crowe is a top-10 public accounting and financial services firm with offices worldwide. As a UX Design & Research Manager, I had the opportunity to create and manage a new UX Research, Testing, and Optimization practice (UX-RTO for short).
This project will attempt to explain the UX-RTO practice using a sample of the remarkably "non-corporate" visual aids that I produced to answer FAQs that I received while socializing and scaling this practice.
My Role:
UX Research & Design
UI Design
Process creation, implementation, and management.
Question 1: What is RTO?
Data-driven research & testing, conversion rate optimization, and traditional UX and UI Design.
The Research, Testing, and Optimization practice functions like most mixed-methods UX Research practices. That is to say, it uses qualitative and quantitative research tools and methods to generate valuable insights about our users, and the way they interact with our digital products. However, unlike traditional research practices (that start with a request and end with a report), we mostly generate our own “requests” and our work doesn’t stop until our optimizations have been fully designed and implemented. This makes our RTO practice more of a turn-key, data-driven, optimization practice than a research practice.
Research, test, optimize is a common human process that most people use intuitively in their everyday lives. If you’ve bought a vehicle before, you probably conducted some sort of research, took a little test drive, and then made the vehicle your own through various modifications/optimizations.
Research

Learning what end-users of a system, product, or service need and want. Effective research is all about building empathy & understanding for our users and their needs.

Testing

Evaluating the effectiveness of products, services, prototypes, and other experiences through data-driven (qualitative and quantitative) testing and experimentation. Testing methods include A/B, Multi-variant, URL Redirect, UserTesting, Usability, Performance, and more.

Optimization
Applying research and testing insights to systems, products, and services through thoughtful and deliberate design improvements. This step often includes UX, UI, IA, Strategy, Best Practices, Standards, Design Systems etc.


Optimization through the aggregation of marginal gains.
Question 2: What’s the RTO Philosophy
The “Marginal Gains” philosophy (also known as the 1% rule) was coined by British cycling coach and performance director Dave Brailsford.
The whole principle came from the idea that if you broke down everything you could think of that goes into riding a bike, and then improved it by 1%, you will get a significant increase when you put them all together. [1]
As someone who’s worked on an e-commerce Conversion Rate Optimization team that was always on the lookout for fractional improvements, this philosophy was a perfect fit for my new RTO practice. The more I learned about how Brailsford infected his team with his contagious fixation on data-driven improvements, the more convinced I became that this philosophy wasn’t only right for a UX-RTO practice, it was also right for personal development… and for life in general.
Said more simply, I believe that even the most seemingly insignificant UX improvements can contribute in meaningful ways to high-value optimizations.
#OptimizeEverything

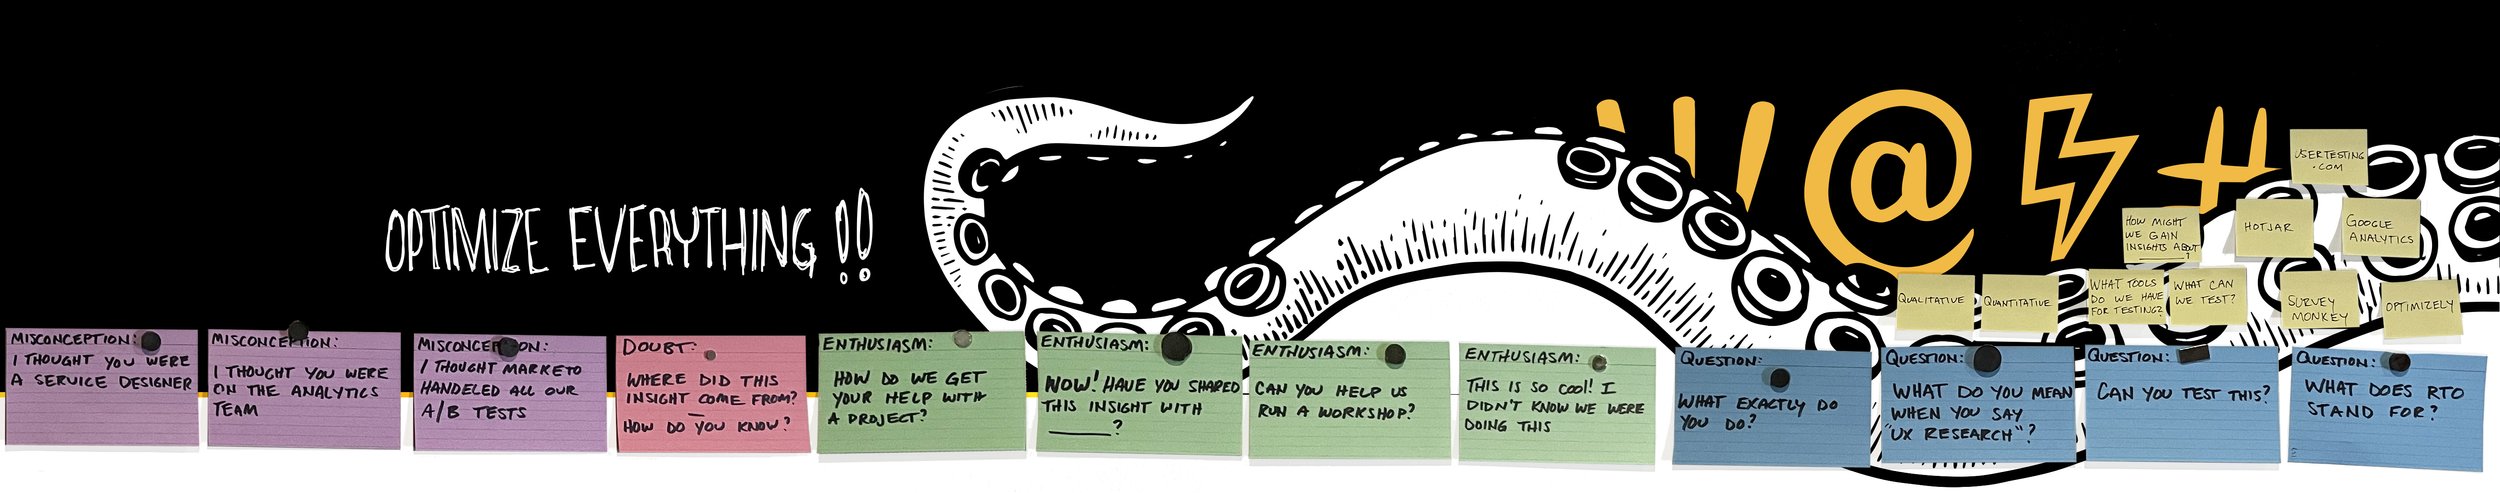
Question 3: Where do your insights come from?
RTO insights come from observations and data
Qualitative Data
Qualitative data is non-numerical data that is collected through open-ended methods such as interviews, focus groups, and observation. Qualitative data provides insights into the attitudes, motivations, and behaviors of users. This type of data is often collected in the early stages of a UX research project and can help researchers generate hypotheses and design ideas.
Quantitative Data
Quantitative data, on the other hand, is numerical data that is collected through methods such as surveys and analytics. This type of data provides statistical information on user behavior and can be used to measure the effectiveness of design solutions. Quantitative data is often collected in the later stages of a UX research project to validate design decisions and measure the impact of design changes.
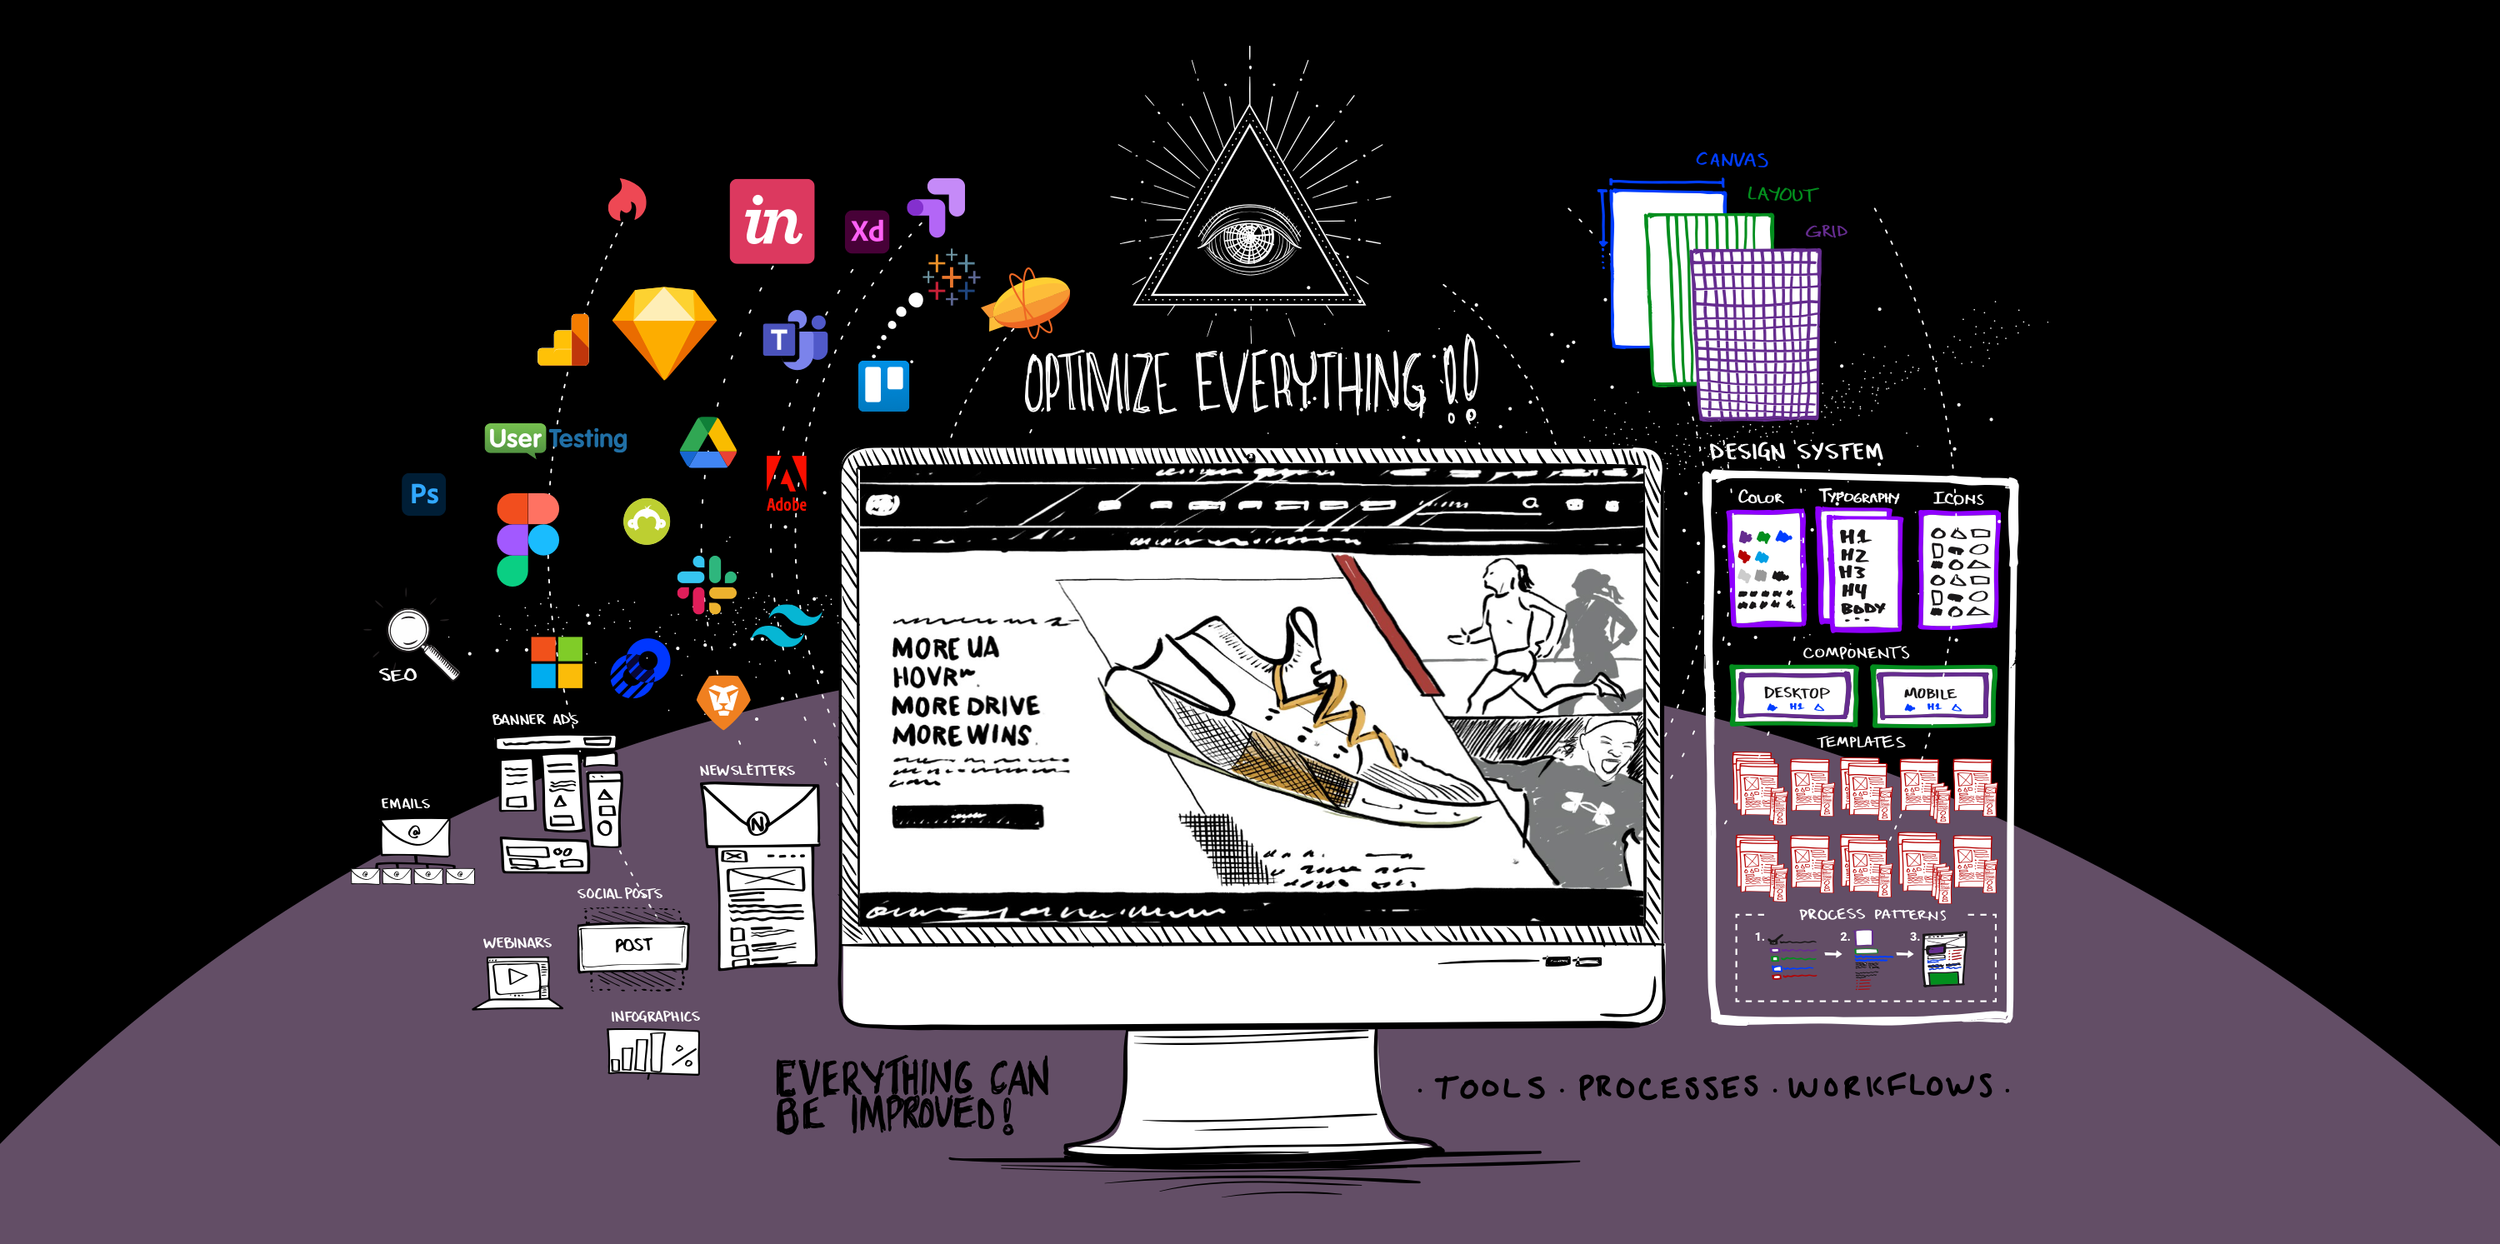
Optimizing everything!
Outcome Spotlight
Since it’s launch, the UX-RTO practice at Crowe has improved UX and lead generation conversion rates by collecting, analyzing, and translating qualitative and quantitative research data into finished design solutions. Working cross-functionally, we’ve improved internal processes, workflows, tools, end-to-end user journeys, design system components, templates, prototypes, pages, emails and more.
[1] Slater, Matt (8 August 2012). "Olympics cycling: Marginal gains underpin Team GB dominance". BBC Sport. Retrieved 11 April 2014.